Concept note
This project is a tangible data visualization of the functionality of cookies saved by different websites. The project was done as a part of the student exchange program at the Glasgow School of Art under the interaction design studio.
Intent
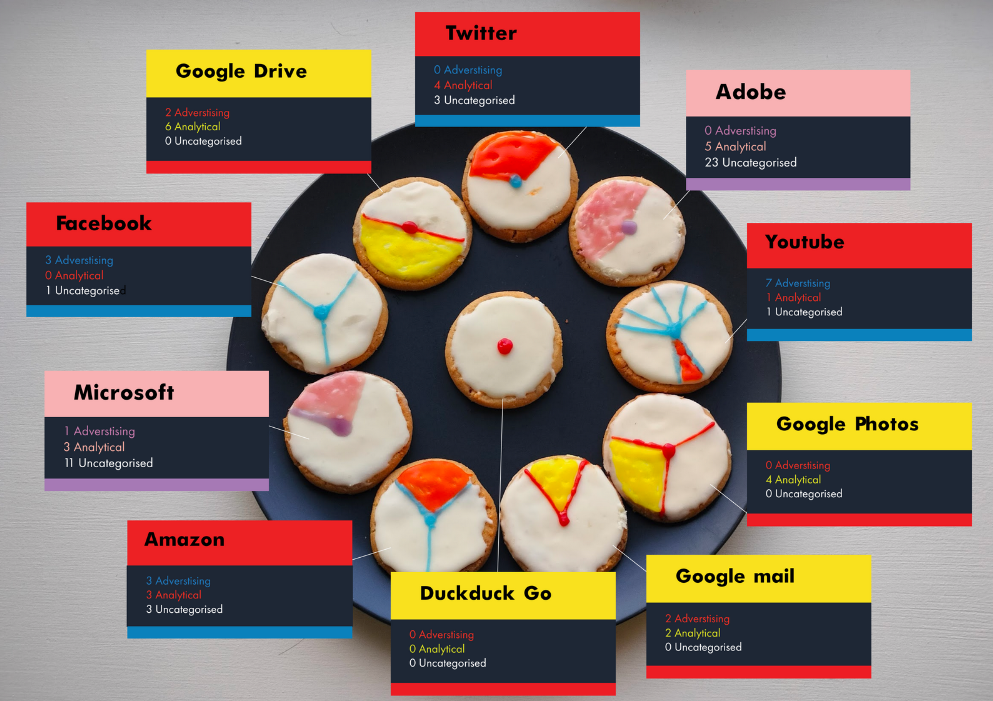
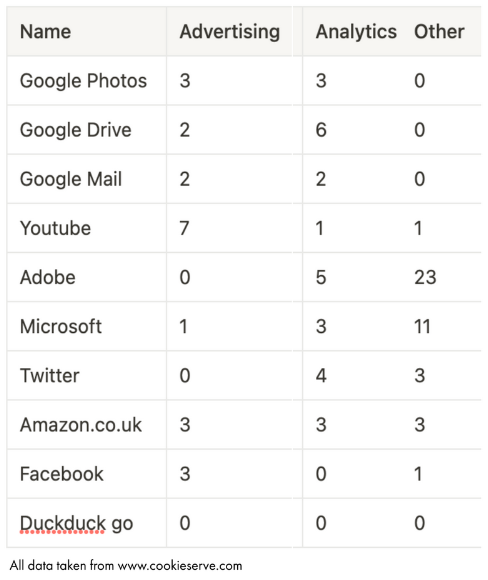
The intent of the project was to create a tangible creative visualization of otherwise invisible data. I decided to go ahead with online tracking because it is generally invisible which makes a lot of consumers ignorant on what kind of data is being taken from these and for what purpose it is being used. Since I was looking at online tracking and data collection through cookies, I decided that it would be interesting to visualize them on actual cookies. The visualization informs the user of the number of cookies collected by popular websites and their functionality. The data is taken from a website called cookie serve which divides cookies into 3 large categories - advertising, analytical and uncategorized.
Developing a visual language
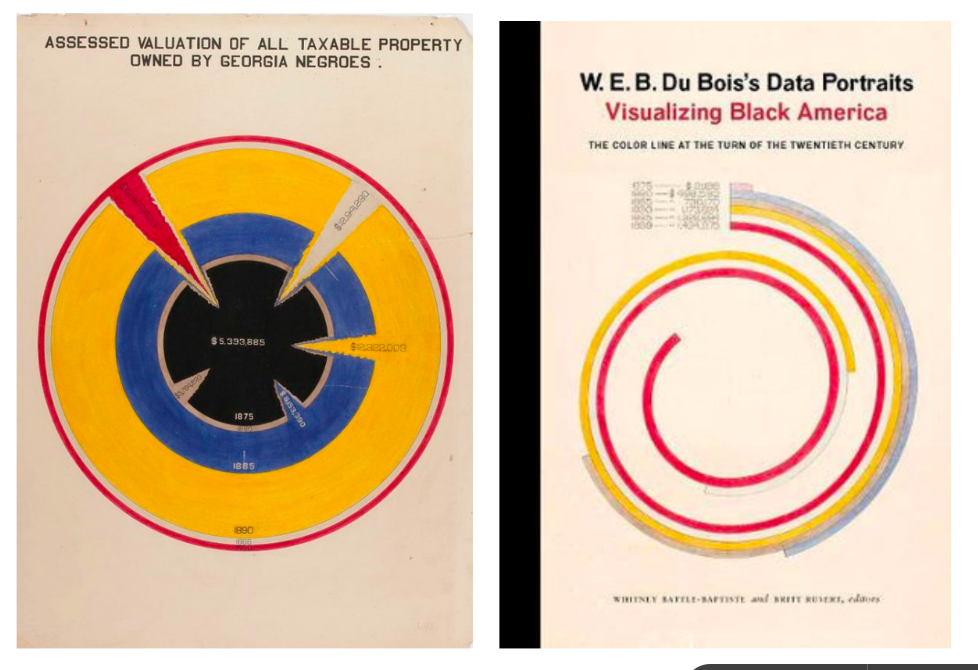
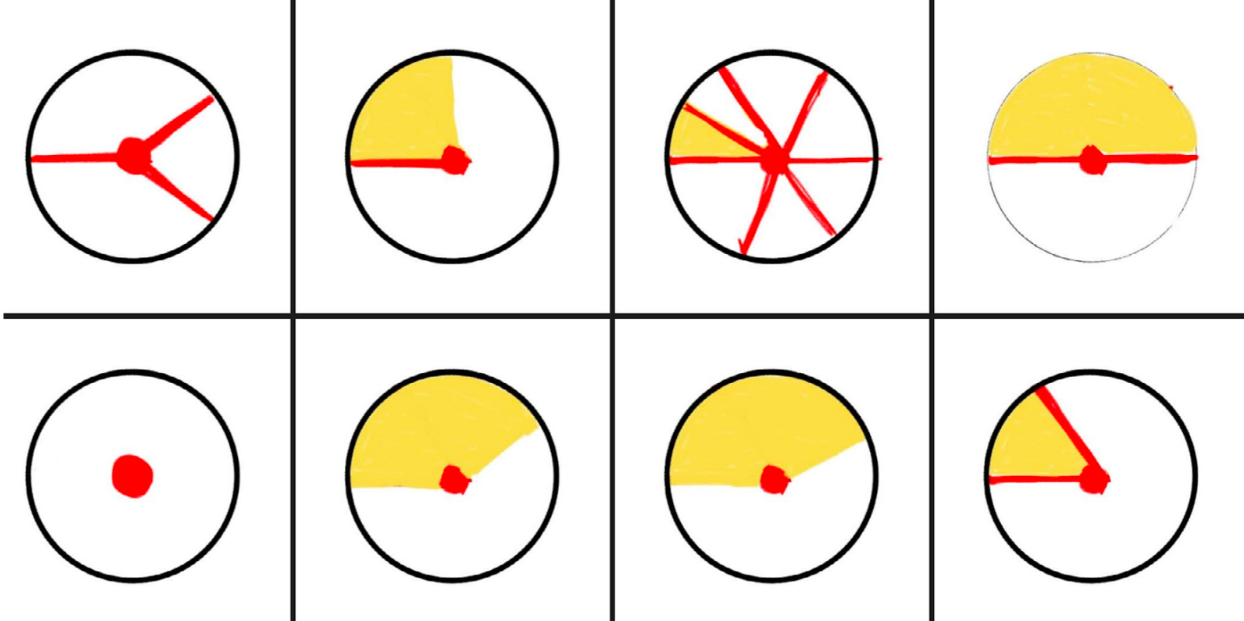
The data from cookieserve categorized the cookies into 3 types based on their functionality and I wanted to depict the number of cookies in each type. To come up with a hand drawn visual language, I took inspiration from the work of W.E.B Du Bois.
Visualization
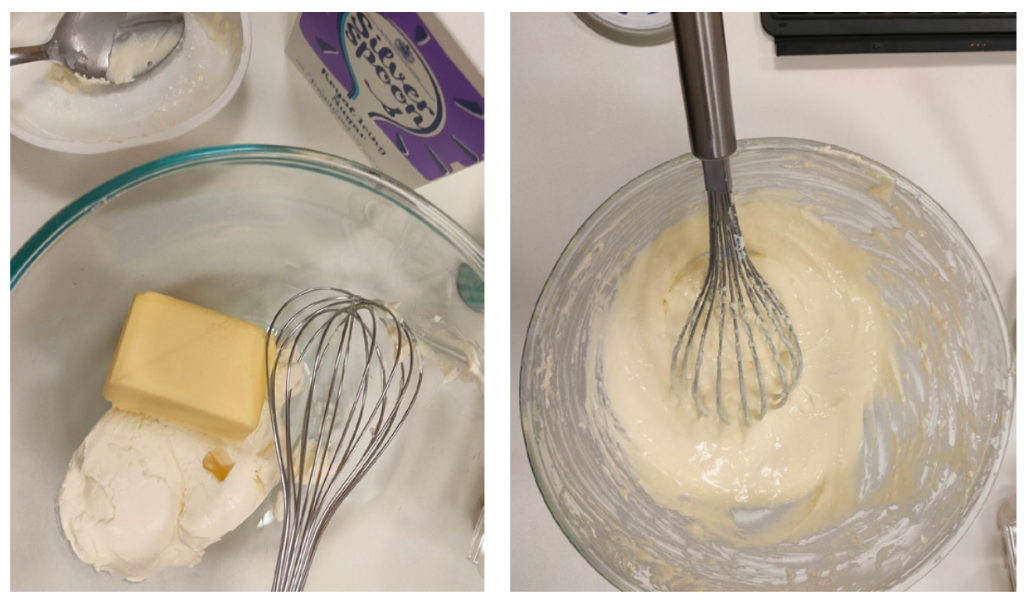
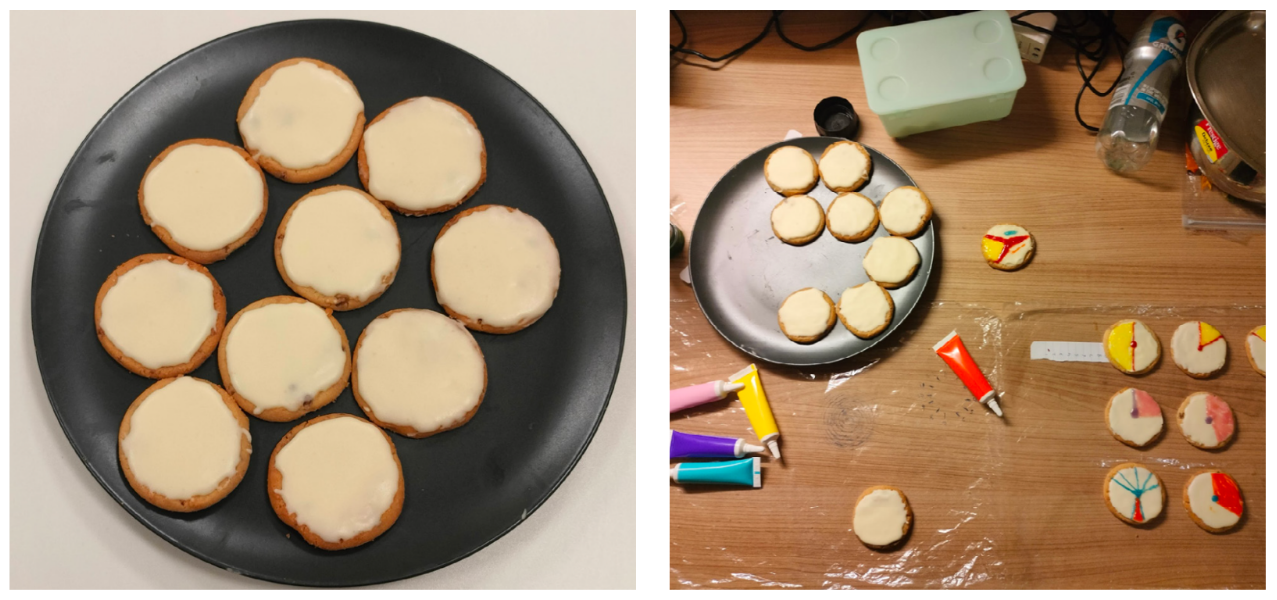
For actually visualizing them on cookies, I decided to get the cookies with the largest surface area I could find from TESCO. I put a layer of cream cheese frosting over it and used icing tubes to draw over it. These cookies arranged on a plate were exhibited as part of the Design Domain exhibit at the Glasgow School of Art.